Learn how to create and edit forms.
Before you create a new form, you must first determine what data you want to display in the grid (also known as a grid or table). For this purpose, Qvantum offers three different modes that can be used to configure the rows and columns. A description follows later in this article.
However, it is not recommended to place all the dimensions of your model in the rows and columns, as this would quickly lead to a rather confusing form given the large number of dimensions. Dimensions that are not in the grid are in the form header.
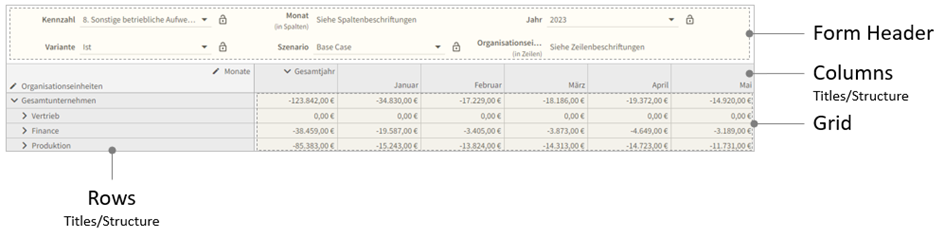
Figure 1 - The components of a form
The form header
Regardless of the design of your form, there are most likely some dimensions whose currently selected element is only visible in the form header (see Figure 1). This selection is of great importance in order to understand what the numbers in the grid stand for.
For example, the Years dimension is located in the form header and is not part of the rows or columns. No matter what inputs are made in the grid, it's important to note whether the numbers are for 2022 or 2023.
Creating Forms Using the Form Grid
Configuration of rows/columns
The row/column dialog (Figure 2) can be used to define the content for the form.

Figure 2 - Configuration of the rows/columns
Set mode
First, you'll lay out the mode for your rows or columns. The following modes are available:
- Automatically by dimensions
The rows are automatically created according to selected dimensions. - Automatically by layers
The rows are automatically created according to selected layers. - Manual
The rows are created manually by you one at a time.
Let's start with automatic creation based on dimensions.
Automatically by dimensions
Once you've selected a dimension, you can choose a node to filter the dimension (see Figure 3). Only those elements that are below the selected node are included.

Figure 3 - Dimension and Filter
When adding a second dimension, note the "Hide Empty Rows" option. After you set the first dimension, hiding the blank rows is still optional. With the addition of the second dimension, it is no longer possible to automatically show all empty rows.
Automatically by layers
For the configuration of the axis in the "Automatic by layers" mode, the dialog is a little different. In contrast to the "Automatic by dimensions" mode, the layer selection is now added for each selected dimension.

Figure 4 - Configuration of the rows in "Automatically by layers" mode
When creating the structure in the "Automatic by layers" mode, select (1) a dimension from which you then select (2) a layer (see also Figure 4). In this way, you can overlay hierarchical layers from different dimensions and create a fundamentally new structure for your rows or columns.
To filter specific areas within the dimensions and layers used, you can open the "Set Filter" category by clicking on it. The dimensions that are currently being used for selecting the layers are listed there. For each dimension, you can select a node to output only this selection, including its child elements, in the form.
Attention!
If you can't select one or more dimensions, it's probably because the layers haven't been named yet. You can add names for your layers to your model using the XLS configuration file.
Add custom rows and columns
Column
After you have defined the dimensions for the columns, you must click on "Add new row" or "Add new column" to specify which row/column will be created. In this dialog for creating a new row/column, further options are also available. It is possible to prohibit input or to show a comment row/column.
If you prohibit entry, your planner will not be able to enter data in this column. With the option "Show comment row/column" you have the choice between the comment type "Free text" or "Free text + template".

Figure 5 - Creating a new column in "Manual" mode
Calculation row or column
In addition to a data column, you can insert a calculation row/column into your form. Specify "Cell Name"/"Column Name" and the "Formula" for the calculation row/column. You can find out more about arithmetic operations and formulas here.
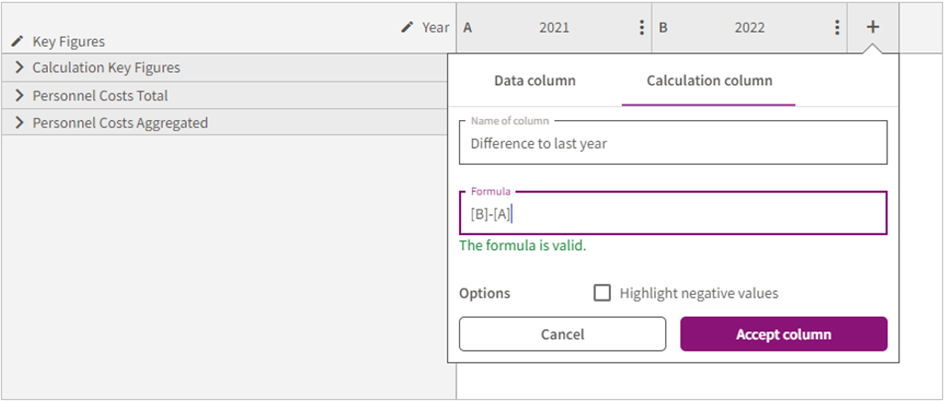
Figure 6 - Formula input in a calculation column
"Highlight negative values" option
This option highlights all negative values (-1 and lower) in the form in red that are in that row or column.